Table of Contents
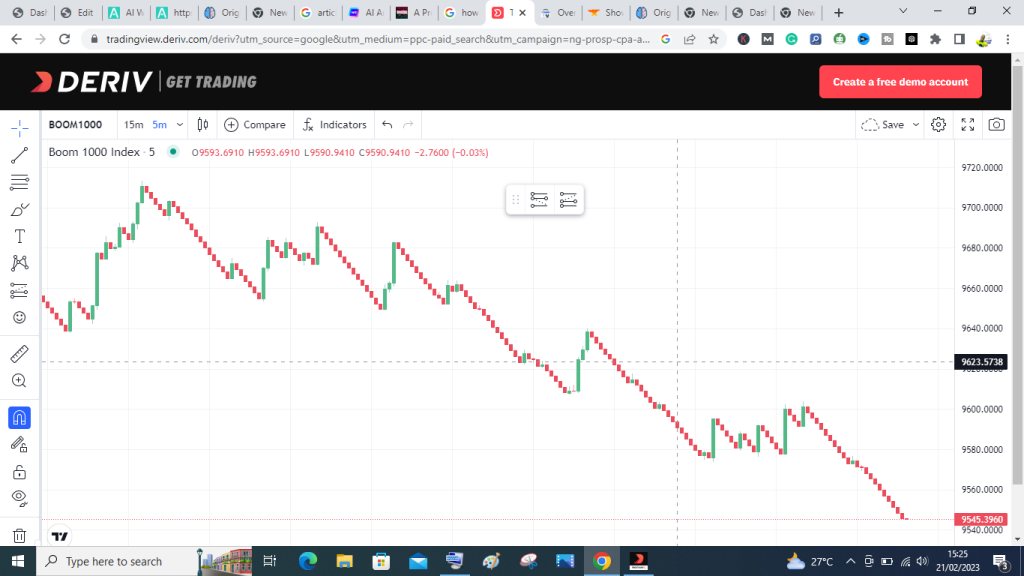
Boom and Crash Strategy
A boom and crash strategy is a method of trading that seeks to generate profits quickly while also limiting losses. This type of trading may suit those traders who feel comfortable using high levels of leverage.
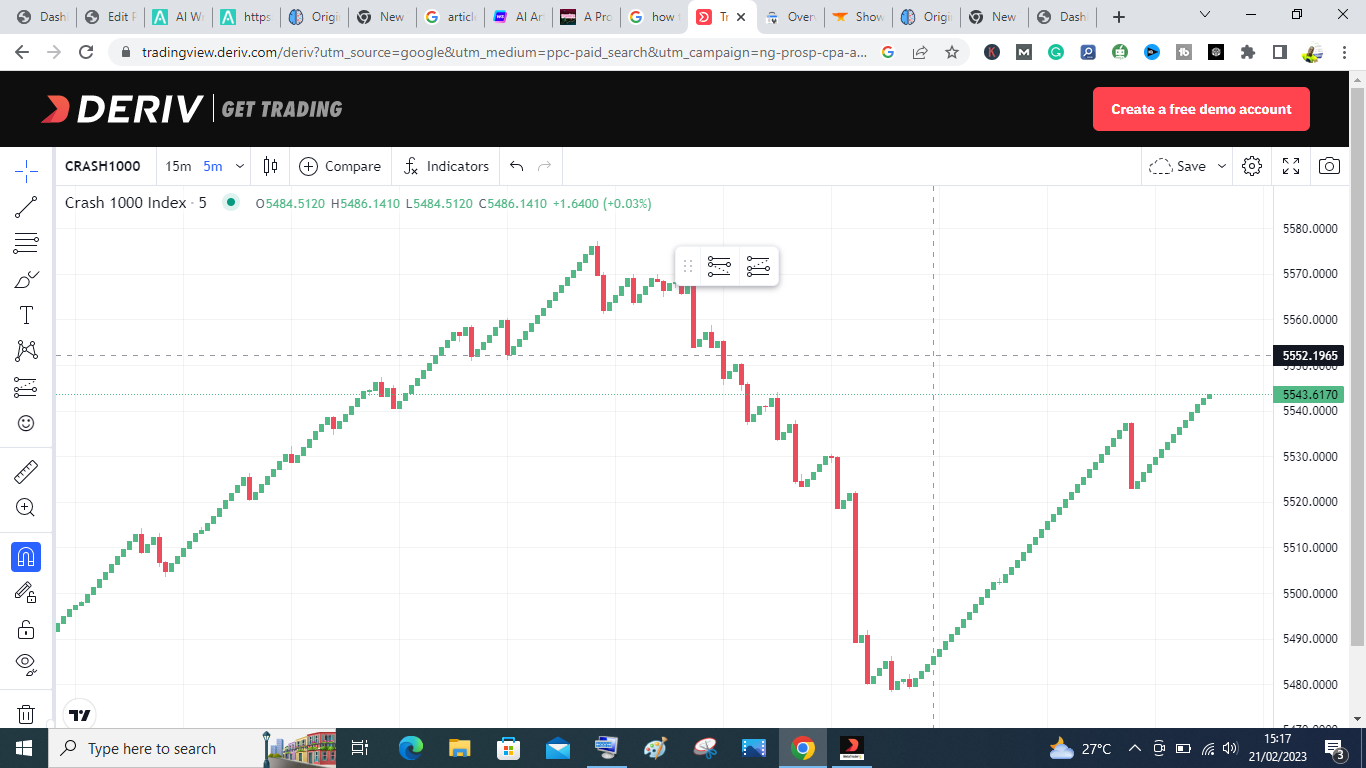
Indexes are notorious for their sharp spikes and drops that can cause large profits or losses in a short amount of time. While these fluctuations may be scary to new traders, if one uses caution and the correct techniques they can be highly rewarding.
First and foremost, traders should create their own boom and crash strategy based on their individual trading style, trading psychology, market exposure and understanding of the structure. It should also include an approach for entering and exiting positions as well as one for managing risk.
Strategy for trading boom and crash
There are various strategies available for trading boom and crash markets. Some rely on indicators, while others rely on price action.
* Indicators: Many traders have discovered the power of indicators in detecting market spikes. These tools help identify support and resistance levels as well as potential entry points.
For instance, the RSI indicator is often employed by boom and crash traders to detect price spikes in synthetic pairs. This indicator has the advantage of being able to detect sudden shifts of prices that may range from 50 pips for a boom index, to as little as 10 pips during a crash index.

Another helpful tool is the Ichimoku cloud indicator, which can automatically detect support and resistance levels on a chart. When an index crashes or surges against an Ichimoku support or resistance level, prices often spike at that point.
The Ichimoku indicator is an invaluable trading aid and should be utilized in combination with other tools. For instance, it can be employed to detect supply zones in crash indices and to target these areas for buying or selling.
best boom and crash strategy
You can use the Ichimoku indicator to recognize supply and demand zones in boom indices, helping you capitalize on price spikes. And best of all? These zones are easy to spot and can be applied on any chart timeframe – even one-minute ones!
Risk management requires setting a stop-loss in the boom and crash indices that is based on your equity and trading style. This should be set approximately 10-20 pips below demand zones, helping to prevent an enormous loss.
Before trading with real money, it is recommended that you practice with a demo account first. This gives you the chance to test out various trading strategies and see which ones work best. Doing this can teach you how to manage your capital effectively and make informed decisions in the market.